 |
|||
| Previous Page | Home | Table of Contents | Next Page |
| Runoff Report 1999..... Water Flow |  |
|
|
|
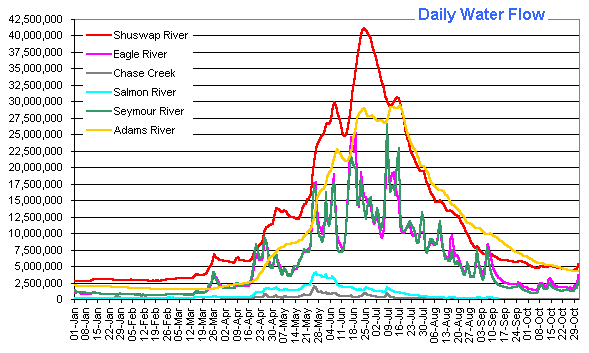
Water flow data are very different from the water levels, even they are directly calculated from them. A stream water level only describes the height of the water above the bottom. Flow data are the calculated amount of water transported by the stream in a certain amount of time, measured in cubic-meters per second. The water flow is the result of a simple hydrological open-channel calculation (Manning's equation / Simpson's rule) including the following factors:
The standard unit of m³/sec only shows the momentary flow. To be more compatible with the lake values and to show the actual daily lake inflow I will convert all flow data to m³/day (factor 86,400). The following chart indicates the daily lake inflow (m³/day) from the major streams. |
|
 |
|
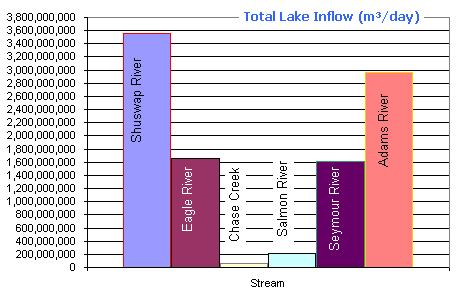
| For the year of 1999 (January 01 to October 31) the accumulated lake inflow calculates as follows. |
|
 |
|
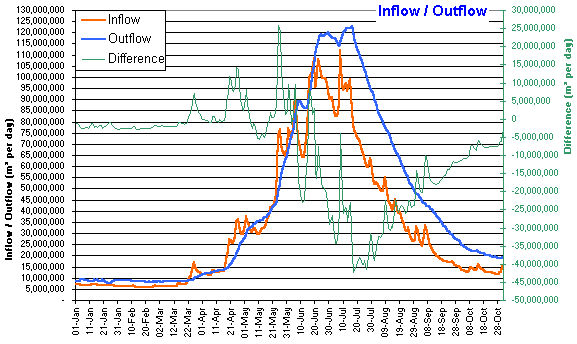
As shown here the Shuswap River carried the most water into the Shuswap Lake, closely followed by the Adams River (group 1). Eagle River and Seymour River were almost identical (group 2) while the remaining streams of group 3 seemed to have no significant impact on the lake. The total lake inflow by those 6 streams for 1999 was 10,048,489,344 m³, compared to a total outflow of 12,822,874,560 m³. The difference of 2,774,385,216 m³ (equals an average of 106 m³ per second) can be explained by the direct lake inflow of other streams as well as by the water from the snowpack close to the lake. The difference actually was much higher considering the fact that the lake level was much lower in January than in October. On the daily basis for 1999, the difference between lake inflow (by the 6 major streams) and total outflow is shown in the next chart. |
|
 |
|
The green line refers to the values on the right and shows the difference between the recorded lake inflow and the total lake outflow. Positive numbers indicate higher inflow than outflow, negative numbers higher outflow than inflow by the major streams. The graph clearly outlines the time periods where the 6 major streams carried more water into the lake than the lake was able to discharge. Given by the very fast lake level increase during this time it can be assumed that the actual lake inflow was much higher, also taking in the water from the snowpack close to the lake. The limited data available to this research does not permit calculations about the precise effect of a certain stream on the lake. Maybe in the future I will program a calculated simulation, provided that I get the required data for it. This report can only compare a stream to the lake drainage. The result may be just an indicator for its effect on the lake. |
|
| === Top of Page === | |
|
Copyright (C) 2003 Bernhard Kramer, Sicamous, BC - Canada webmaster@shuswaplakewatch.com |
|