 |
|||
| Previous Page | Home | Table of Contents | Next Page |
| Runoff Report 1999..... Final Comparisons |  |
|
|
|
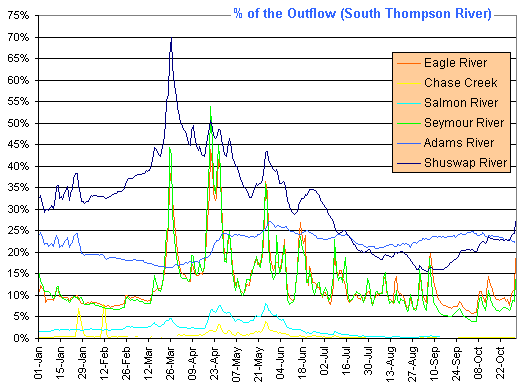
The following 2 charts give an overview for the importance of the 6 major streams through comparison. The first graph illustrates the relation of each stream to the Shuswap Lake outflow (South Thompson River). |
|
 |
|
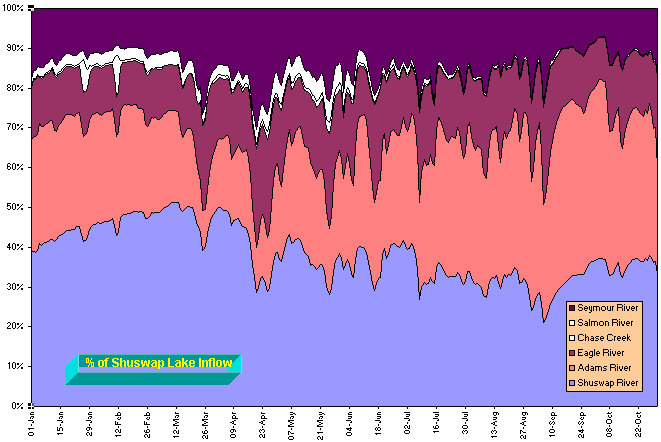
The most interesting facts in this chart are the provided by the group 1 streams, the Shuswap River and the Adams River. As shown on previous charts both streams are the largest water contributors for the runoff. While the Shuswap River played an exceptional important role for the behavior of the Shuswap Lake, the Adams River was a constant source throughout the year by always contributing only between 16% and 25% of the lake outflow. The group 2 streams also show a very interesting relation to the outflow. Both streams (Seymour River and Eagle River) react very similar in time and contribution. Combined they were capable to push the lake level up very significantly. Please note that by adding up the percentage values for a certain day during the main runoff the sum may exceed 100%. This effect is caused by the fact that the outflow was much less than the inflow during a fast raise of the lake level. The daily inflow for every stream is separately calculated in relation to the outflow in order to show its effect more accurately. Finally, the last graph shows the relation of each stream to the total lake inflow by all 6 streams. |
|
 |
|
Each stream in this chart is accumulated to the total inflow of 100%by all 6 streams. |
|
| === Top of Page === | |
|
Copyright (C) 2003 Bernhard Kramer, Sicamous, BC - Canada webmaster@shuswaplakewatch.com |
|