| Runoff Report 1999..... Water Levels |
 |
|
The gauges in the streams record the water level in period of 15 minutes. The values are then converted to water flow reports in m/s using special charts and functions. Stream level data are only important for short-term flood forecasting for certain floodplains by comparing them to recorded spill levels. Flow data describe the actual amount of water being transported by the river. Therefore in this report I will exclusively concentrate on flow data for all calculations, where water flow per second is transformed into water flow per day. This allows better comparisons and calculations for the effect of the stream on the lake.
Some stream data for the 1999 runoff are already listed in Table 3 of the section Data Stations. Data are available for the time from January 01 to October 31. Some values are based on estimates because of temporary malfunction of the gauges. In case of the Salmon River the last 6 weeks for this time period are still not available. All data are preliminary and still subject for verification by Environment Canada, which is usually done by the end of March 2000. My database will be updated by then.
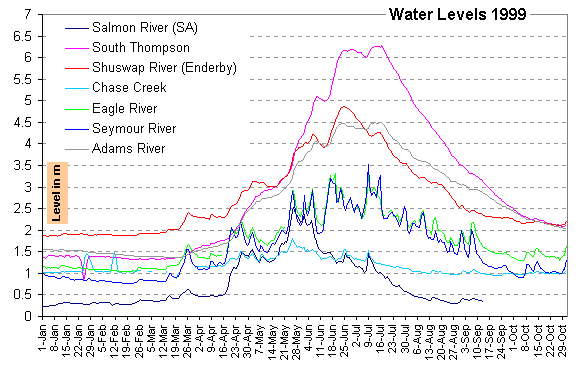
The following chart is comparing the water levels of the major streams for 1999. It gives some indication of each size and the level changes during the runoff.
|
 |
Before going into the flow rates I will analyze this chart a little more. The pink line represents the South Thompson River, the only outflow from the Shuswap Lake. Its level is directly related to the lake level itself and therefore indicating the reaction of the lake in respect to the inflow.
All the streams can be placed into groups based on timing and reaction during the runoff. Groups are indicating similar topographic conditions for the runoff as well as similar water potentials and flow intensity. The chart points towards 3 groups as follows:
|
|
|
Group 1
|
Shuswap River
|
Both cover the largest area, therefore carrying most of the lake inflow |
|
Adams River
|
|
Group 2
|
Seymour River
|
Medium sized streams, almost identical runoff reactions and potential (Salmon River may fit in this group during the early runoff) |
|
Eagle River
|
|
Group 3
|
Salmon River
|
Smaller streams with low significance for the lake |
|
Chase Creek
|
|
The streams of group 2 are almost identical in every aspect. It indicates a very similar distribution of the snowpack in different altitudes. Changes in water levels occur on the same day for all streams of this group.
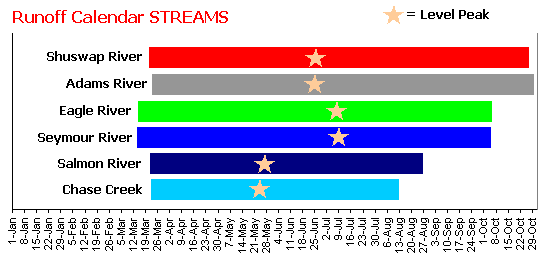
The next graph reveals the stream levels more clearly inside the 1999 runoff period.
|
 |
This graph indicates that group 3 reaches its peak first, followed by group 1 and finally by the 2nd group.
Assuming equal weather and temperature patterns for the complete runoff area this graph allows some further conclusions for the different stream groups.
|
|
Group 1:
|
Both streams in this group are the longest effected by the runoff. They are also the largest streams in the Shuswap Lake watershed. Both reached their peaks by the end of June after a constant level increase. Following the peak both stream levels decreased slowly. The Shuswap River reached its normal level by the end of October, while the Adams River continued far into November before being back to normal. The Shuswap River is partially controlled by the Sugar Lake Dam, maintained by BC Hydro for generating power. More details to that later in this report.
A large number of creeks and streams leading into both rivers created a constant high inflow before and during the peak. With the long and cooler rain period starting just before the peaks the relation between drainage and inflow equaled out for about 2 weeks before the stream levels started to fall (with some differences for the Shuswap River because of flow regulations at the Sugar Lake Dam). The large portion of a medium and high altitude snowpack then caused a slow level decrease in both streams. The high snowpack and relatively mild temperatures prevented the melting of all the snow especially in high altitudes. Colder temperatures simply stopped the runoff here before it was complete. |
|
Group 2:
|
The streams of group 2 carry most water from medium and high altitude. The early signs of the runoff were caused by the low altitude snowpack leading to high stream levels until the beginning of May. A large area covered with medium altitude snowpack dictated constant level changes in accordance with daily temperatures. Both reached its peaks at the same time as the Shuswap Lake. While the streams of group 1 basically maintained their close-to-peak levels during this period, the peak of group 2 had significant impact on the Shuswap Lake, which led to the second and final peak of the lake. Like group 1, the remaining snowpack after the peak was limited to upper medium and high altitudes. Group 2 streams also descended slowly towards their normal levels, normalizing in early October. |
|
Group 3:
|
Group 3 streams had only insignificant impact on the Shuswap Lake. Both are smaller streams carrying water from a much shorter distance than the others are. The Chase Creek is by far the lowest ranking stream in this order. Most of its water during the runoff is produced by a low altitude snowpack, which leads to an early peak with no effect on the lake at all. The Salmon River also carries most of its water from the low altitude snowpack with an early peak. Because it is much longer than the Chase Creek more water is being transported in this time. Until its peak by the end of May the Salmon River reacts very similar to weather and temperatures like the streams of group 2. A very small medium and high altitude snowpack causes a fast decrease of its water levels shortly after the peak. Its effect on the lake was insignificant. The Salmon River simply ran out of its snow water supply before the peak of the Shuswap Lake. |
|
| === Top of Page === |
Copyright (C) 2003 Bernhard Kramer, Sicamous, BC - Canada
webmaster@shuswaplakewatch.com |


