 |
|||
| Previous Page | Home | Table of Contents | Next Page |
| Runoff Report 1999..... Regional Runoff Properties |  |
||
|
|
|||
The Shuswap Lake runoff area is a complicated network of streams and lakes. Many creeks carry the snow water into smaller lakes. Most of those lakes act as regulator or buffer zones during the runoff just like the Shuswap Lake itself. The complexity and extend of this system demands a very intensive and time-consuming analysis which will probably last until late next year. Therefore I will ignore the stream network at this point and concentrate exclusively on the Shuswap Lake. In the previous pages I already described some of the general properties for the Shuswap Lake. We know that all the snow water from this very large region eventually ends up in one of the over 520 streams, creeks or lakes and gets carried away, finally reaching the Shuswap Lake. The only outlet, the South Thompson River, has to move this water mass into the Pacific Ocean. |
|||
|
|||
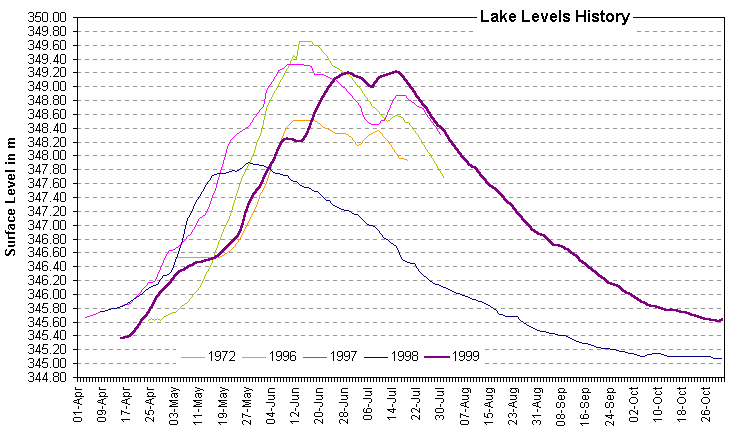
The volume of the inflow depends on the snowmelt and is much larger than the outflow during the main runoff. The result is a raising surface level of the Shuswap Lake. In the flood year of 1972 the lake level increased by 4.04 m to an elevation of 349.66 m during the runoff. This record is unbroken until today. And another record was set in 1972: the daily lake level increase reached a maximum of 24 cm, recorded by a gauge near Salmon Arm and maintained by the District of Salmon Arm. This value is still subject for verification since gauges seem to malfunction from time to time (it is definitely true for some recordings during the 1999 runoff!). I will come back to that later at this page. Based on those gauge recordings the largest daily level decrease was 16 cm in 1999, which seems unrealistic given by own measurements and lake history. A maximum of 7 to 8 cm level decrease per day should be a more realistic value. Therefore I will use the 1999 measurements from own readings (7.2 cm) for all calculations in this respect. The Shuswap Lake level is a very good indicator for the general runoff conditions and progress throughout the region. I will come back to that in the chapter about the lake forecasting. First let's take a closer look at the lake level history shown in the chart below. |
|||
 |
|||
| Source: District of Salmon Arm (1972, 1996, 1997, 1998), Shuswap Lake Spring Flood Research Project (1999) | |||
This graph is showing the daily Shuswap Lake surface levels during the runoff for the years of 1996 to 1999 as well as the flood year of 1972. To analyze the data we have to split the runoff timeframe into 3 major periods as follows. |
|||
| 1. Start of the runoff, raising lake levels |
|||
The graph shows that the level increase usually starts during the last 2 weeks of April, which marks the begin of the runoff season. Warmer daytime temperatures initiate the snowmelt but colder nighttime temperatures interrupt this process. The result is a slow daily level increase at first for a relative short time. With warmer temperatures also reaching into the night, the main runoff starts and the lake raises fast until it reaches its peak. This almost linear process is only interrupted by some colder weather patterns, usually rain periods with substantial cloud cover, which causes cooler temperatures during the day. The fast raising lake levels indicate a snowmelt in lower and medium altitudes as explained in the previous page. The water flow through the stream network is at its maximum. The flood danger for the lake is low, but high for streams and lakes further inside the stream network. |
|||
| 2. The peak |
|||
The lake reaches its peak after approximately 6 to 8 weeks, depending on the snow pack and weather. Incoming water first equals the outflow for 3 to 5 days before the outflow slightly exceed the inflow. This fact clearly indicates the disappearance of the low altitude snow pack and the remission in medium elevations. The snow surface is lower reducing the water supply. Depending on the remaining snow pack in medium altitude this period can last up to 2 weeks. Unusual warm temperatures or rain periods can easily push the lake level up again as seen in 1999. Temporary level increase may indicate a snowmelt in higher altitudes. This period incorporates a high flood danger for the Shuswap Lake shoreline area, major streams close to the lake because of the back flow caused by high lake levels, and for the area downstream of the South Thompson River, since it has logically to carry its maximum on water now. |
|||
| 3. Falling lake levels, end of the runoff season |
|||
A constantly decreasing snow surface produces less water than the outflow is able to carry away. The result is a slowly falling lake level until it reaches its normal state. This should be between mid October to mid of November. There is no flood danger associated with this period. Another important factor for the peak level is also shown in the graph for the 1999 runoff. The peak level of 1998 was exceptional low and early during the short runoff period. This caused the lake to fall below its normal level during the winter and created additional buffer space for the 1999 runoff, enough to compensate for the higher snow pack and to prevent major flooding. Combined with cooperating weather pattern made the 1999 runoff season a lucky one. |
|||
| Gauge Data Verification | |||
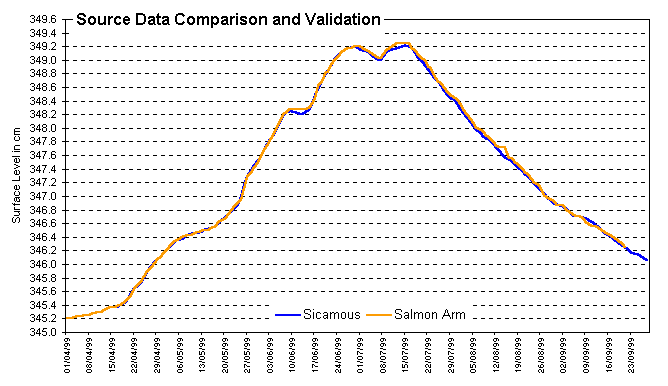
This graph shows the recordings of the Shuswap Lake gauge for 1999 in comparison to own measurements taken at Mara Lake. |
|||
 |
|||
| Source: District of Salmon Arm (1999), Shuswap Lake Spring Flood Research Project (1999) | |||
The lines are almost identical, pointing only to a few false recordings for the gauge. The precision of the gauge is 1 cm while the Mara Lake measurements are done at a precision of 1 mm. All false readings are easily recognizable by the horizontal leveling of the graph line, which indicates equal recordings for some days during a temporary decrease of the actual level. Therefore the analysis for the 1999 runoff will rely on the more precise Mara Lake measurements. |
|||
| === Top of Page === | |||
|
Copyright (C) 2003 Bernhard Kramer, Sicamous, BC - Canada webmaster@shuswaplakewatch.com |
|||