
 |
|||
| Previous Page | Home | Table of Contents | Next Page |
| Runoff Report 1999.....Weather Conditions |  |
|
|
|
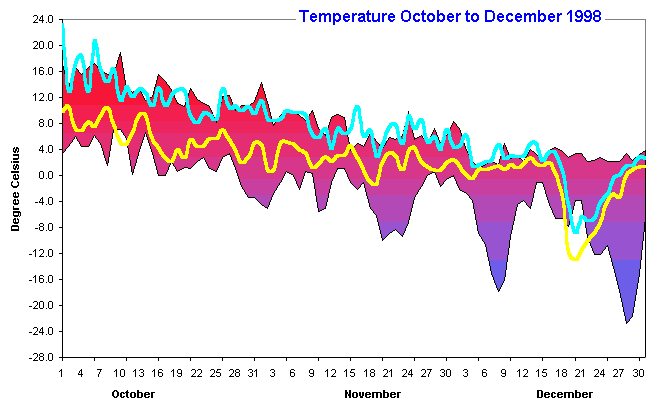
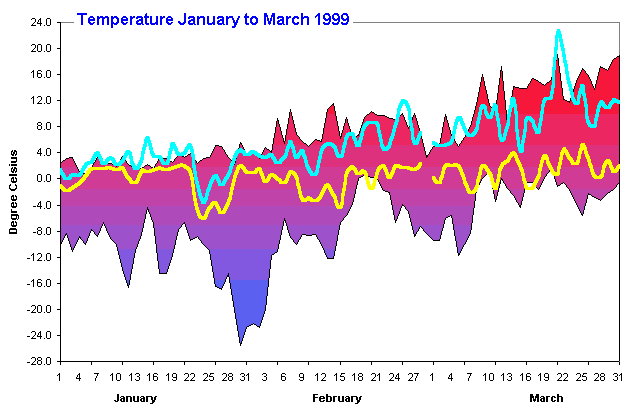
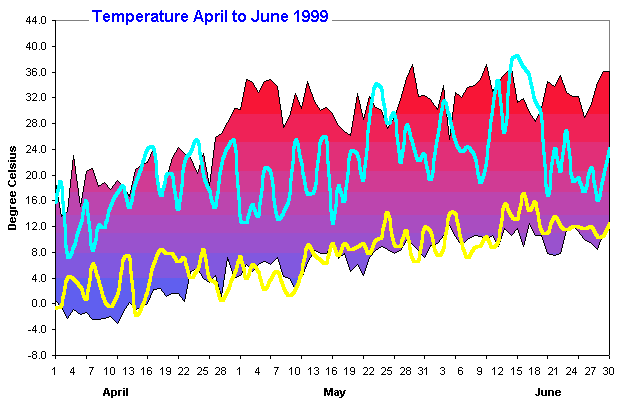
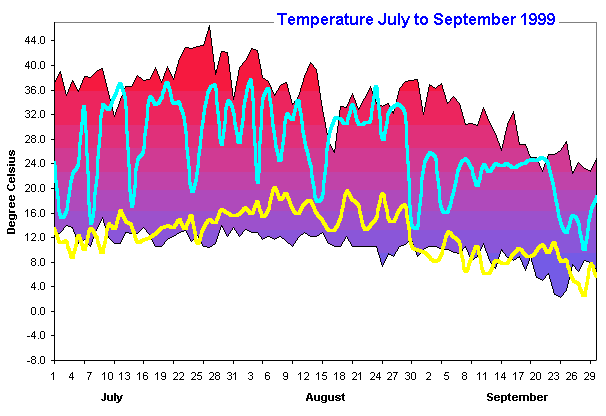
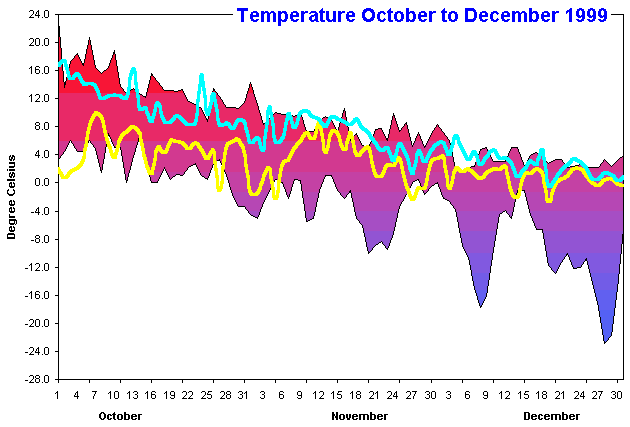
This page displays the 1999 temperature graphs for the Shuswap Lake at Sicamous. All temperatures are given in degree Celsius and represent the daily low / high. The temperatures were recorded by a digital thermometer, starting at December 10, 1995. The precision of the thermometer is not tested, therefore some data could be outside the actual values, especially in the extreme high / low areas. For the numerical weather data for 1999 please follow this link here. To return to this page click on the Back-button of your browser. The graphs show the daily high and low temperatures as a line. The colored background represent the daily high/low record markings from previous years. |
|
 |
|
 |
|
 |
|
 |
|
 |
|
| === Top of Page === | |
|
Copyright (C) 2003 Bernhard Kramer, Sicamous, BC - Canada webmaster@shuswaplakewatch.com |
|