 |
|||
| Previous Page | Home | Table of Contents | Next Page |
| Runoff Report 1999.....Shuswap Lake |  |
||||||||||||||||||||||||||||||||||||||||||||||||||||||||||||||||||||||||||||||||||||||||||||||||||||||||||||||
|
|
|||||||||||||||||||||||||||||||||||||||||||||||||||||||||||||||||||||||||||||||||||||||||||||||||||||||||||||||
The 1999 runoff carried a high potential for flooding in the Shuswap Lake area. Clearly above normal snow levels was indicating excessive water supply throughout the runoff season. The low altitude snowpack was high enough to push the lake level up to advanced markings right in the beginning, while the medium and high altitude snowpack had the potential to bring a constantly large amount of water into the system during the main runoff. High temperature for a period of time or excessive rain periods could easily have led to a disaster. Nevertheless, the 1999 runoff past with relative few problems. Minor flooding occurred on certain sections of streams and along the shoreline. The Eagle River near Sicamous reached 6 times critical levels where water spilled over into surrounding fields. Those spillovers happened between May 27th and July 13th before running out of excessive supply. I have to come back to that in the next section. Other streams may have had similar spillovers. Precise data is not available because of the lack of cooperation from local officials in this matter. But I am not aware of any major problems along other streams. The relative high lake level caused some problems for beach properties. Own observations from the Sicamous area showed some flooding of campgrounds as well as for some beachfront properties. Most property owners seemed to be good prepared and were able to hold most of the water back to avoid major damages. Overall, the damages during the 1999 runoff seemed to be relatively low. It could have been much worse. The potential for disaster was always present, but was never activated. The reasons for that can be identified as:
Some other factors may have been contributed to the total runoff but can be ignored based on their insignificant effect. Most of the water brought into the Shuswap Lake is coming from 5 major streams:
Based on the total mass of inflow other contributions are rather insignificant and can be ignored. There are also no data available to include into the calculations. Those creeks and streams are mainly located close and with direct flow into the Shuswap Lake. Most carry the snow water very early in the runoff freeing the closer lake area from the snowpack. They seem to be back to normal flow long before the main runoff from the backcountry with minimal or no effect on the lake level. As for the larger streams please check the next chapter for further details. |
|||||||||||||||||||||||||||||||||||||||||||||||||||||||||||||||||||||||||||||||||||||||||||||||||||||||||||||||
 |
|||||||||||||||||||||||||||||||||||||||||||||||||||||||||||||||||||||||||||||||||||||||||||||||||||||||||||||||
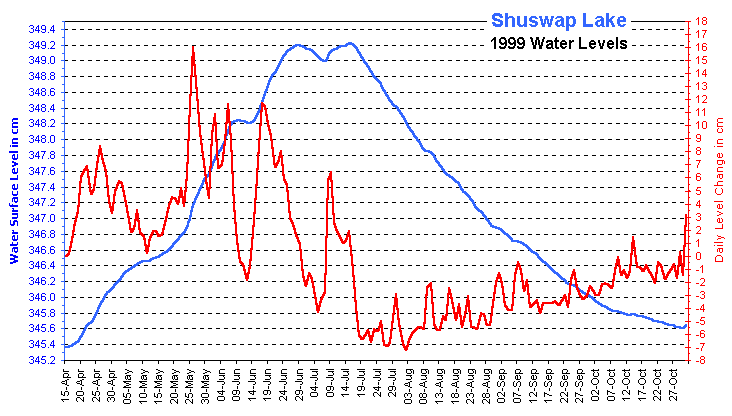
For the moment I will focus on the daily lake level changes. Following the red line clearly identifies 3 major phases inside the 5-stage total runoff (as explained later). Those phases are directly related to the remaining snowpack and the overall weather conditions: |
|||||||||||||||||||||||||||||||||||||||||||||||||||||||||||||||||||||||||||||||||||||||||||||||||||||||||||||||
|
|||||||||||||||||||||||||||||||||||||||||||||||||||||||||||||||||||||||||||||||||||||||||||||||||||||||||||||||
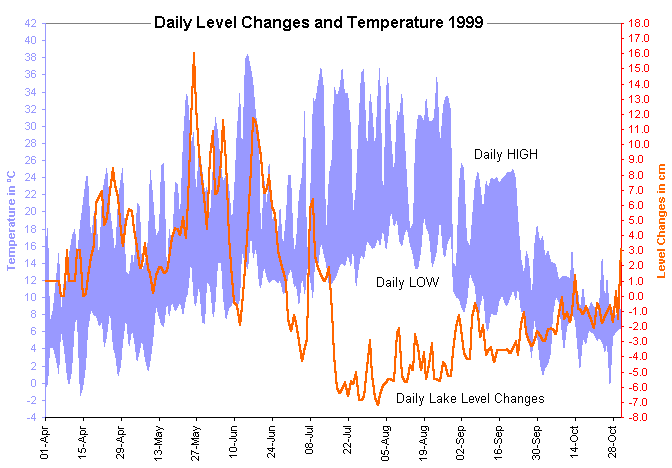
| The next chart best explains the effect of the weather to each of the just described phases. |
|||||||||||||||||||||||||||||||||||||||||||||||||||||||||||||||||||||||||||||||||||||||||||||||||||||||||||||||
 |
|||||||||||||||||||||||||||||||||||||||||||||||||||||||||||||||||||||||||||||||||||||||||||||||||||||||||||||||
During the first and most of the second phase the lake reacted very fast to changes of daytime temperatures. High temperatures always are followed by a clear increase of the lake level. By the end of the second phase this pattern began to change. The reaction of the lake was far less intense and the delay increased noticeable. This is a clear indication for the reduction of the remaining snow supply, which then was limited to higher altitudes, and the longer way the water had to travel from the source to the stream and lake. The snow water takes a certain amount of time from the source to the lake. I call it lake reaction delay. This delay is depending on factors like snowpack, altitude, distance from the lake, temperature changes, soil conditions, backwards temperature patterns and intensity. Other factors like consitency of the snowpack and topographic conditions are disregarded here. With aid of the previous chart some temperature peaks were extracted and set in relation to the corresponding lake level changes. The difference between the dates calculates the mean delay in days. The following table calculates the lake reaction delay for some temperature peaks: |
|||||||||||||||||||||||||||||||||||||||||||||||||||||||||||||||||||||||||||||||||||||||||||||||||||||||||||||||
|
|||||||||||||||||||||||||||||||||||||||||||||||||||||||||||||||||||||||||||||||||||||||||||||||||||||||||||||||
| Based on those calculations the lake reacts to temperature increases with a delay in Phase 1 of 2.8 days, Phase 2 of 2.6 days, and Phase 3 of 3.9 days. The overall mean delay for the complete runoff calculates to 3.2 days. Understanding this fact provides a very important tool for the short-term forecasting. It has proven very effective and precise during last year's predictions. And most importantly, it gives enough time for flood preparations after announcing flood warnings. The next chapter will analyze some rivers in this respect. There is also a difference in lake level changes during day and night. It seems logical since temperatures during the day are usually much higher than at night, which results in a larger snowmelt at daytime followed by an increased water flow into the lake. The accessible data does not allow delay calculations separated by day and night with a certain minimum on precision. But my own measurements may give some ideas about the general tendency in this regard. The lake level changes, separated by day and night, are shown on the next graph.  Lake level increases are always larger at night than at day. During the first phase those differences are minimal, but more recognizable during the second phase. This effect is reversed during the third phase, where the lake level decreases more at night than during the day. This allows the simple conclusion: regardless of decrease or increase, level changes for the Shuswap Lake are always larger during the night. The weather is the most important factor during the runoff. Weather means not just temperatures. Equally important for the snowmelt are the following weather and other components:
and some other more. The following three graphs demonstrate a combination of
A larger scale also will allow a more detailed view of the data. Please click at the links below to view the graph. |
|||||||||||||||||||||||||||||||||||||||||||||||||||||||||||||||||||||||||||||||||||||||||||||||||||||||||||||||
| Part 1: April to May 1999 Part 2: June to July 1999 Part 3: August to September 1999 |
|||||||||||||||||||||||||||||||||||||||||||||||||||||||||||||||||||||||||||||||||||||||||||||||||||||||||||||||
| A continuum into later of the year is irrelevant. Please keep in mind that all the weather conditions are recorded in the Sicamous area. Given by the large area covered by the runoff the weather conditions could have been different at other locations. A regional separation would have required a more detailed data access, which I failed to gain. Nevertheless, the weather recordings provide a good indication for the overall conditions. The last 3 graphs cover a timeframe of 166 days. The weather codes on the bottom represent for this period a total of
The 61 sunny days dictated the 1999 runoff. Rain had no or almost no effect on the runoff as clearly indicated on the graphs. This may be the result of mostly light rain or short rain showers without the potential of creating excessive water in a short time. The longest rain period happened in the second half of June and lasted 16 days. During this time the daily lake level changes constantly decreased, even causing the lake level to fall temporarily. Relative cool temperatures during this period may have aided to this fact by slowing down the snow melting process. |
|||||||||||||||||||||||||||||||||||||||||||||||||||||||||||||||||||||||||||||||||||||||||||||||||||||||||||||||
As described earlier, a number of factors had significant importance for last year's runoff. The next sections will give a short description to each factor. At this point it will be assumed that you have read previous chapters of this report. |
|||||||||||||||||||||||||||||||||||||||||||||||||||||||||||||||||||||||||||||||||||||||||||||||||||||||||||||||
| === Top of Page === | |||||||||||||||||||||||||||||||||||||||||||||||||||||||||||||||||||||||||||||||||||||||||||||||||||||||||||||||
|
Copyright (C) 2003 Bernhard Kramer, Sicamous, BC - Canada webmaster@shuswaplakewatch.com |
|||||||||||||||||||||||||||||||||||||||||||||||||||||||||||||||||||||||||||||||||||||||||||||||||||||||||||||||