 |
|||
| Previous Page | Home | Table of Contents | Next Page |
| Runoff Report 1999..... Shuswap River 4. Closing comments |
 |
|
|
|
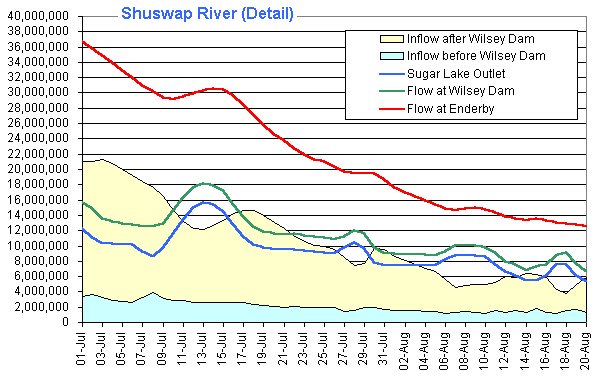
The Shuswap River is the major source of water during the runoff for Shuswap Lake inflow. Its capability to produce a high amount of water in a very short time gives this stream the highest potential for flooding in the Shuswap Lake watershed. Weather and temperatures effect all sections of the stream at the same time leading very fast to flow and level peaks, especially in the area downstream of the Mabel Lake. The water management for the Sugar Lake reservoir is a key factor for flood control and flood prevention. The delayed discharge of the Sugar Lake inflow extended the time span for the runoff and effectively reduced the potential of flooding in the whole region. The unusual high snowpack in all elevations was capable to heavily overload the flow capacity of the stream throughout the summer. Early in July the Sugar Lake reached its maximum storage capacity exactly at a time when the Shuswap Lake was close to its peak. Only a few days of continuous warm temperatures easily could have given the year of 1999 its place in the regional flood history. The weather pattern of 1999 had a very positive impact on the Shuswap River. Mild temperatures allowed a snow melt mostly during daytime, giving the stream the opportunity and time to carry the water away before continuing with the meltdown. This pulsating effect from the water source kept the stream in a more balanced condition with high but moderate water levels and flow rates. An exceptional cool period in mid of June interrupted the runoff for nearly 2 weeks, just when the whole watershed was close to critical levels. The water flow for the Shuswap River immediately started to decrease, never getting back to its previous levels. As illustrated in Chart 3.1, one of the reasons for that was the combined buffer effect of Sugar Lake and Mabel Lake. Both lakes had enough time to drain a large portion of its water, creating new room for new storage. After the cool period as described above the resumed runoff only had the power to fill those lakes inside their storage capacities. The Chart 3.1 illustrates that for the Sugar Lake, which temporarily came close to its free spill level. There are no measurements available for the Mabel Lake but Chart 3.5 clearly shows a higher stream flow for the Sugar Lake outlet and the Wilsey Dam, accompanied by a larger local inflow below the Wilsey Dam as shown in Chart 3.6. Despite the significantly increased water flow in those sections the recordings in Enderby did not share the same effect. The Enderby gauge readings showed only a minimal increase for the water flow in the same time. This clearly points to some storage of water with the Mabel Lake being the only suspect. Chart 4.1 illustrates that by a detailed view for this time period. |
|
 |
|
This explains that the storage or buffer capabilities of the Mabel Lake can be an important factor for the runoff and should be properly measured in the future. Doing that could increase the effectiveness of the water management at the Sugar Lake in respect of flood control by including the Mabel Lake storage capacity into consideration for the Sugar Lake discharge. |
|
| === Top of Page === | |
|
Copyright (C) 2003 Bernhard Kramer, Sicamous, BC - Canada webmaster@shuswaplakewatch.com |
|