
 |
|||
| Previous Page | Home | Table of Contents | Next Page |
| Runoff Report 1999..... Shuswap River 3. Shuswap River Runoff |
 |
|
|
|
In this section I will analyze the 1999-runoff conditions for the Shuswap River in more detail. Beginning with the Sugar Lake inflow I will follow each section (based on table 2.2) downstream before finally ending with the general effect of the stream on the Shuswap Lake. |
|
3.a Sugar Lake (inflow / outflow) |
|
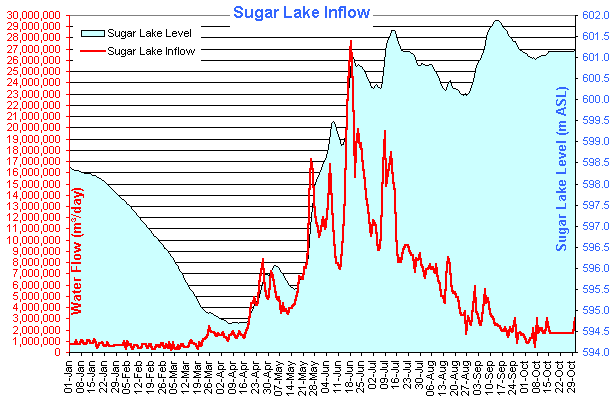
As described earlier the Shuswap River between the spring and Sugar Lake carries most of his water from the upper medium to high altitude snowpack during the runoff. Because of the higher temperatures required to start the melting process in those altitudes the increased water flow starts usually later in this section. Based on BC Hydro's calculated data for the lake inflow the main runoff in this section started on May 16 and peaked on June 19. Chart 3.1 illustrates the Sugar Lake inflow in relation to the Sugar Lake surface level. |
|
 |
|
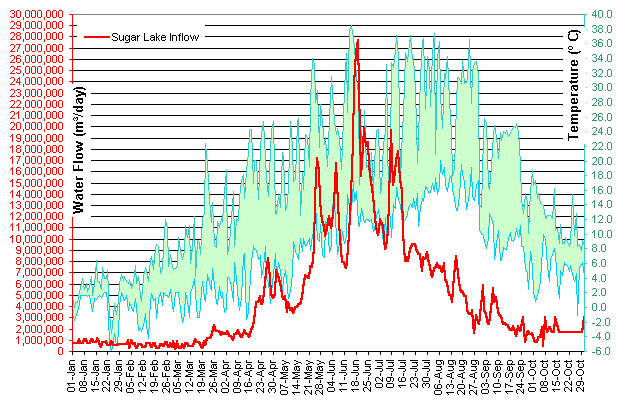
Because of the large amount of water flowing into the relatively small lake the Sugar Lake reacts very fast to increased inflow, almost instantly. The dam than keeps the level high. Chart 3.2 puts the lake inflow in relation to the temperature. Again, the temperatures are recorded in Sicamous. The long distance to the Sugar Lake as well as the higher altitude actually may result in different and cooler local temperatures. But it gives an indication for the general tendency. |
|
 |
|
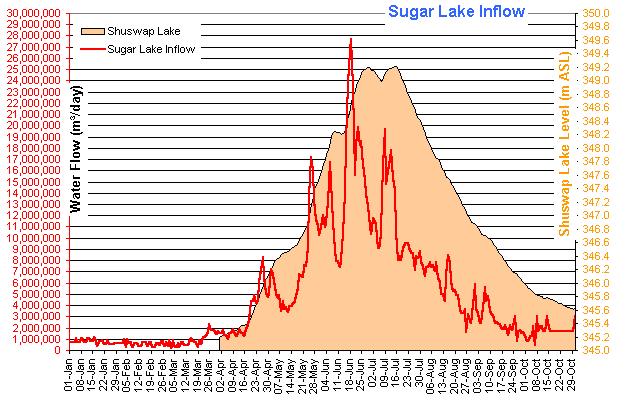
The green background in this chart represents the daily high / low temperatures. The delay time between the temperature increase and the reaction of the Shuswap River seems to be identical with that of the Shuswap Lake. Chart 3.3 brings the Sugar Lake inflow in perspective to the surface level of the Shuswap Lake. |
|
 |
|
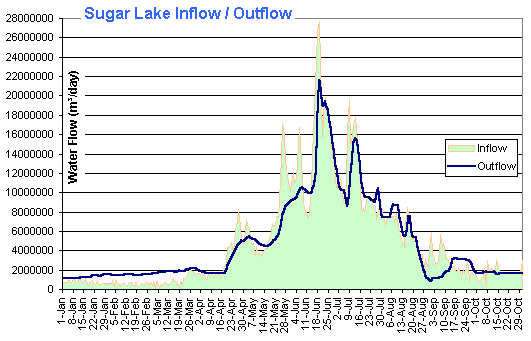
As mentioned before the Sugar Lake inflow is only secondary for the Shuswap River downstream. The first important section begins at the Sugar Lake outflow. Chart 3.4 compares the Sugar Lake inflow and outflow. |
|
 |
|
3.b Sugar Lake Outflow to Wilsey Dam |
|
Just over 96% of the Sugar Lake inflow were drained in the period from January 01 to October 31. This calculates to 40.2% of the total Shuswap River discharge. At the next gauge at Shuswap Falls this value had increased to 53.6% of the total discharge. The difference between those data stations indicates an additional local inflow of about 25%. Besides a few smaller creeks the major portion of this inflow came from 2 larger streams, the Cherry Creek and the Ferry Creek. The effect of the temperature on the snowpack is almost identical to that of section 1. The inflow over time is more stabile and not as intense as at the Sugar Lake. But the timing is the same. High discharge at the Sugar Lake is always accompanied by a high local inflow in this section. A chart will show this later more clearly. |
|
3.c Wilsey Dam to Enderby (Shuswap Lake Inflow) |
|
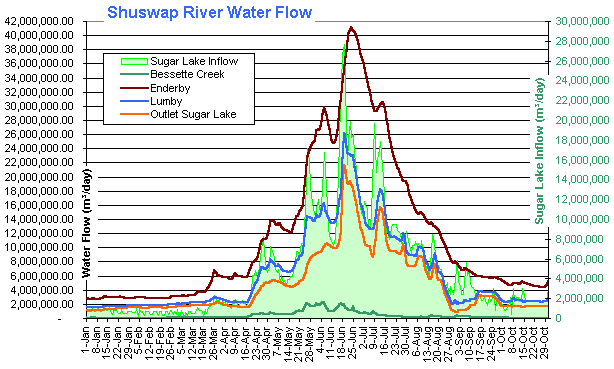
The next and last data gauge of the Shuswap River is located in Enderby, before discharging into the Shuswap Lake. The distance between Enderby and Shuswap Lake (Mara Lake) is relatively short with no significant additional inflow. Therefore it is acceptable to use the recordings at the Enderby gauge as final discharge. Shortly after the Wilsey Dam the Shuswap River is joint by the Bessette Creek. It is not completely clear why, but Environment Canada has placed there an additional gauge to record the inflow of this stream. The total inflow into the Shuswap River is rather insignificant since it accounts for only 3.4% of the total, what is an additional 7.3% for this section. Excluding the Bessette Creek, the remaining local inflow until Enderby accounts for 43% of the total Shuswap River discharge. This means that this section is responsible for the largest portion of water during the runoff. Based on the number of streams and their covered area it can be assumed that most of that water reaches the Shuswap River as inflow into the Mabel Lake. The Shuswap River runs through the Mabel Lake, definitely having some form of impact on it. The relative large area of this lake could make it also an important factor for the runoff. Like all other lakes it can be assumed that the lake level changes during the runoff. To make any calculations about the storage capabilities and the delayed discharge of the lake would require some recordings of the surface levels. To my knowledge this is not done by Environment Canada or any other authority. I am still screening the private sector for some form of observations or recordings in this respect. The area before and after Enderby carries the highest potential for flooding. In 1999, some farmland was flooded in the Gridrod area. This is based on own observations from May 25th at a stream level of 3.645m ASL. I am not aware of any other flooded areas during the last runoff, which could allow the link of the stream level to certain spilling or flooding. BC Environment completely refused any cooperation in this matter. The following few charts will illustrate the 1999 runoff conditions more visual for the Shuswap River. Chart 3.5 compares the gauge data of the Shuswap River |
|
 |
|
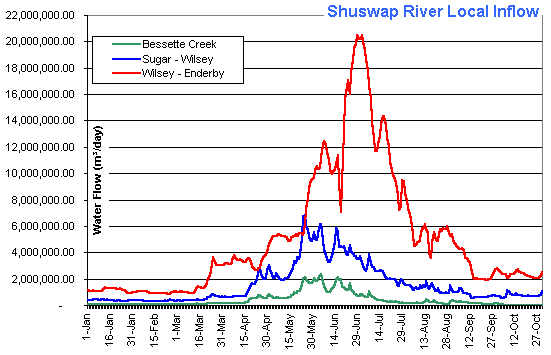
| The light green background gives an informal view at the Sugar Lake inflow. Chart 3.6 shows the stream inflow from different sections. |
|
 |
|
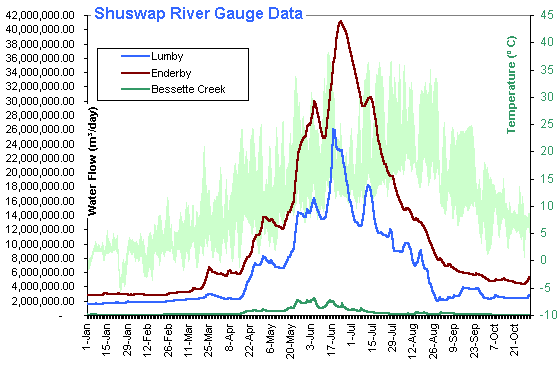
| Chart 3.7 brings the stream flow in relation to the temperatures |
|
 |
|
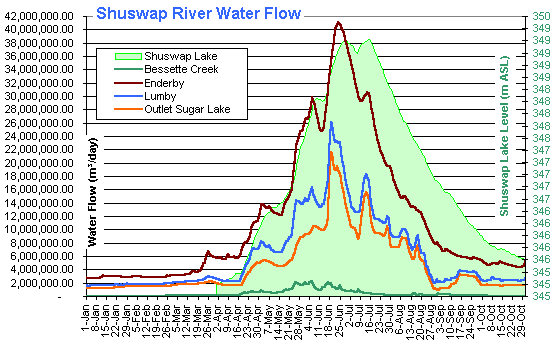
| Finally, Chart 3.8 compares the stream flow to the Shuswap Lake water level. |
|
 |
|
| === Top of Page === | |
|
Copyright (C) 2003 Bernhard Kramer, Sicamous, BC - Canada webmaster@shuswaplakewatch.com |
|